Static Fields: Fall-2025
HW 04 Practice (SOLUTION): Due W2 D5
- Sensemaking from Graphs of Power Series II
S1 5286S
Four students attempted to find a Power Series approximation for \(\cos(5x)\) (graphed in green on all plots). In a few sentences, qualitatively describe what each student did and describe the range of values of \(x\) values for which their approximation is valid.
Of course, whether or not an “approximation is valid” depends a lot on how much accuracy you need in a given application.
Here, we will first mean that the qualitative features are correct, e.g. that the approximation is not increasing when the function is decreasing or the approximation is not concave up when the function is concave down. Next, we will mean that the approximation doesn't differ “too much” from the function. “Too much” is very much open to the interpretation of the person making the decision. (Don't worry - if I have a specific interpretation in mind, I will tell you. Especially on a quiz or exam!)
Some possible criteria are: "I can't tell the function on the graph from the approximation due to the thickness of the lines on the graph", "I need the function and the approximation to agree within 5%" (or whatever percentage you choose), or "My experimental data is valid to the third decimial place so the approximation should agree to that accuracy".
When you are asked a prompt like this, don't over think it. Make a professional choice about what you mean in this context and state what criterion you used. There is no wrong answer. Some examples of things you can say are given in the solutions.
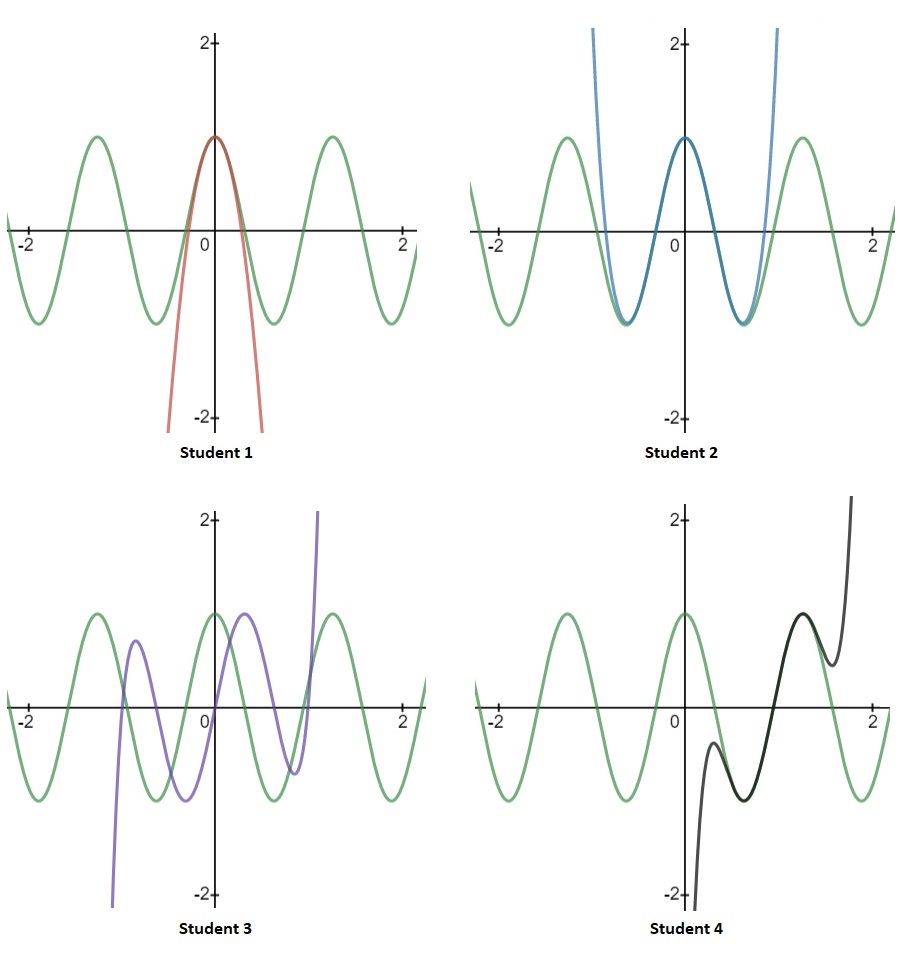
I believe that Student 1 did the power series expansion for cosine of \(5x\) around \(x=0\) and included terms up to 2nd order because I am only seeing one maximum/minimum in the approximation. (The number of max/mins is one fewer than the highest power in the approximation). Student 1's approximation "appears valid" for \(-0.5<x<0.5\). Outside of that region, the approximation remains concave down, but the original function becomes concave up and then oscillates.
Student 2 also did a power series expansion for cosine of \(5x\), but I believe they included up to 4th order terms since I see three max/mins. Graphically, the approximation made by Student 2 is reasonably close to the green curve for \(-1<x<1\).
Student 3 appears to be doing a Taylor approximation for \(\sin(5x)\) instead of cosine, so the series isn't valid for any values of \(x\) even though the function and the power series agree by chance at five isolated points.
Student 4's approximation seems to be antisymmetric around the point \(x=1\). I conclude the student seems to be using a Taylor series expanded around \(x=1\) instead of \(x=0\), i.e. it is written in terms of powers like \((x-1)^n\). Also, if I want the approximation to be valid within a few percent of the maximum value of the function, then it looks like I can use this approximation in the region from \(x=0.5\) to \(x=1.5\).