Static Fields: Fall-2025
HW 03 (SOLUTION): Due W2 D3
- Vector Sketch (Curvilinear Coordinates)
S1 5285S
Sketch each of the vector fields below by hand. You can check your answers using technology. Make sure that you show enough arrows to show the key features of the graph.
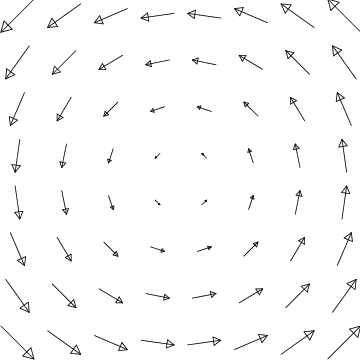
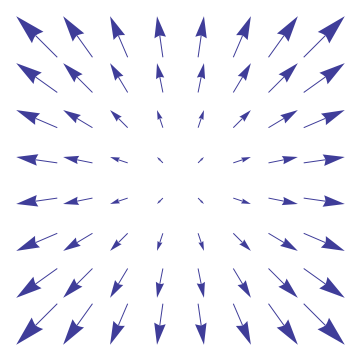
- \(\boldsymbol{\vec K}=s\,\boldsymbol{\hat s}\)
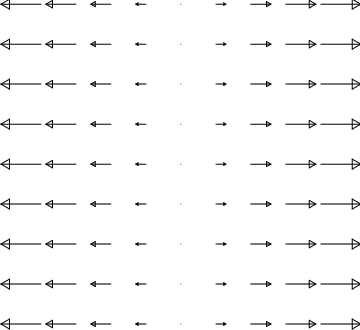
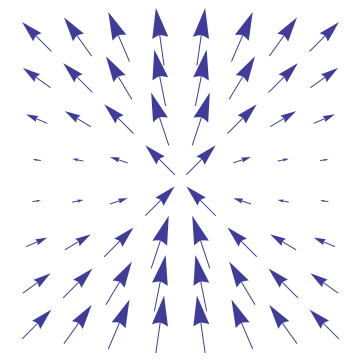
- \(\boldsymbol{\vec M}=\sin\phi\,\boldsymbol{\hat s}\)
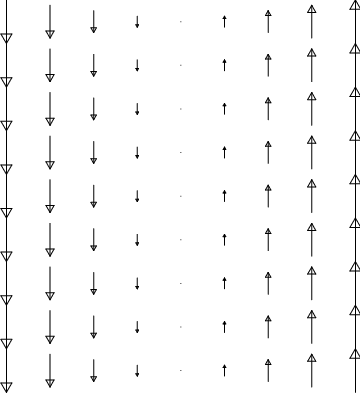
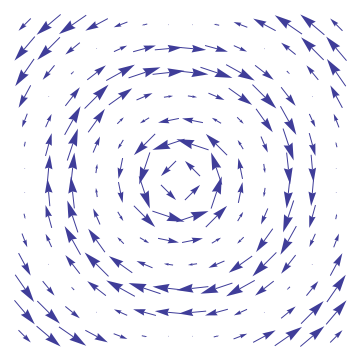
- \(\boldsymbol{\vec N}=\sin(2\pi s)\,\boldsymbol{\hat\phi}\)
-
\(\boldsymbol{\vec K}=\boldsymbol{\vec K}=s\,\boldsymbol{\hat s}\)
The arrows point radially outward and get larger linearly with distance from the origin.
\(\boldsymbol{\vec M}=\sin\phi\,\boldsymbol{\hat s}\)
The vectors all point radially outward. Their magnitudes depend on the angle: \(\sin\phi\) is zero along the \(x \)-axis and a maximum along the \(y\)-axis.
The arrows point tangent to circles (around and around). Their magnitudes vary like the sine of their distance from the origin.
-
\(\boldsymbol{\vec N}=\sin(2\pi s)\,\boldsymbol{\hat\phi}\)
- Circulation I
S1 5285S
The circulation of a vector field \(\boldsymbol{\vec F}\) around a closed curve \(C\) is given by \[\oint_C\boldsymbol{\vec F}\cdot d\boldsymbol{\vec r}\]
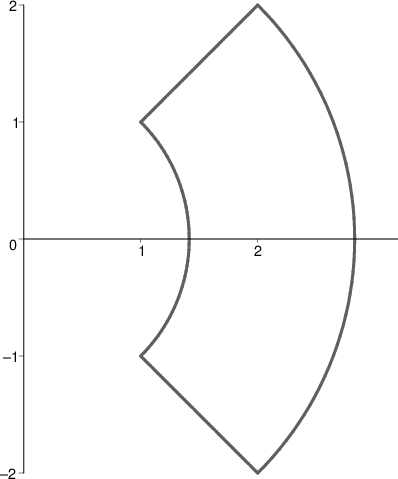
For each of the vector fields below, explain whether you expect the given vector field to have positive, negative, or zero circulation counterclockwise around the closed curve \(C\) in the figure shown above. Two of the segments of \(C\) are circular arcs centered at the origin; the other two are radial line segments. \begin{align*} \hbox{I.}~~\boldsymbol{\vec G} &= x\,\boldsymbol{\hat x} + y\,\boldsymbol{\hat y} \\ \hbox{II.}~\boldsymbol{\vec H} &= y\,\boldsymbol{\hat x} - x\,\boldsymbol{\hat y} \end{align*}
The first vector field, \(\boldsymbol{\vec G}\), is radial, so there is no contribution to the line integral from the circular arcs. Since the two radial segments are traversed in opposite directions, those contributions will cancel. Thus, \(\oint_C\boldsymbol{\vec G}\cdot d\boldsymbol{\vec r}=0\).
The second vector field, \(\boldsymbol{\vec H}\), circulates around the origin, so there is no contribution to the line integral from the radial segments. The two circular arcs are traversed in opposite directions, so those contributions will have opposite sign. However, not only is the magnitude of \(\boldsymbol{\vec H}\) larger on the outer circle, that arc is also longer, so the contribution along this arc dominates the integral. Since the curve is being traversed in a counterclockwise direction, but \(\boldsymbol{\vec H}\) points clockwise, \(\oint_C\boldsymbol{\vec H}\cdot d\boldsymbol{\vec r}<0\).
- Vector Line Integrals
S1 5285S
-
For each vector field \(\boldsymbol{\vec F}\) shown, sketch a curve for which the integral \(\displaystyle\int_C\boldsymbol{\vec F}\cdot d\boldsymbol{\vec r}\) is
positive.
In every case, there are an infinite number of curves that will work. The simplest answers pick any curve that travels along in the same direction as the arrows and stops before any abrupt change in the direction of the arrows (like the origin).
-
For which of these vector fields is it possible to choose your curve to be closed?
For the first vector field, almost any closed curve will have positive circulation (or negative, if you orient the curve backwards). For the third vector field, almost any close curve that lies entirely on the right (or left) side of the graph will have positive circulation. For the second and fourth vector fields, any closed curve will have zero circulation. For the second vector field, you can see this behaviour by putting boxes shaped like squares into the vector field. On each side of the box, either the vectors are perpendicular to the side of the box and hence don't contribute to the circulation OR the vectors on two opposite sides of the box contribute oppositely to the circulation. Any other shaped box can be approximated by breaking it up into lots of little squares. For the fourth vector field, use the same reasoning put choose pineapple chunk shapes for the boxes.
-
- Contours
S1 5285S
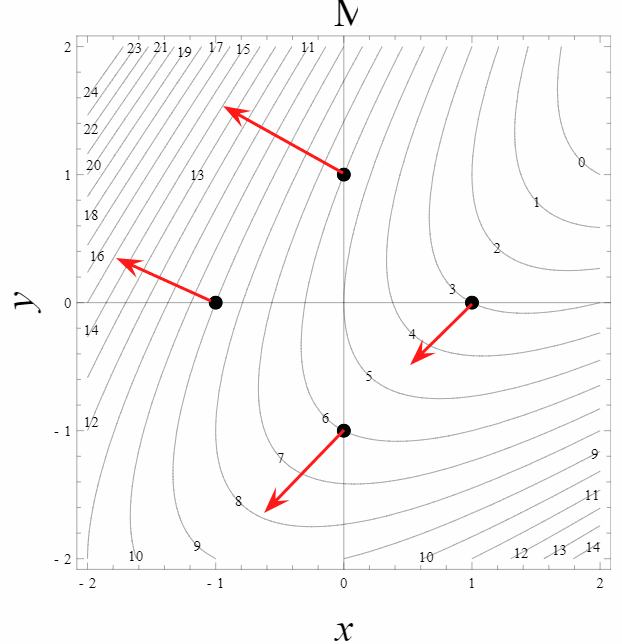
Shown below is a contour plot of a scalar field, \(\mu(x,y)\). Assume that \(x\) and \(y\) are measured in meters and that \(\mu\) is measured in kilograms. Four points are indicated on the plot.

-
Determine \(\frac{\partial\mu}{\partial x}\) and \(\frac{\partial\mu}{\partial
y}\) at each of the four points.
At each point, the partial derivative can be thought of as a ratio of the change in \(\mu\) when there is a small change in either \(x\) or \(y\) where the other variable is held constant (i.e., along either a horizontal or vertical line). To estimate a small change, we will use the smallest change available on the contour map: the change from the value at each indicated point to the nearest contour on both sides. This provides a slightly better estimate of the derivative than choosing only one side or the other, since the function may be changing more or less quickly in the positive or negative directions from the point. In cases where this is not possible due to the shapes of the contours, only the nearest side is used.
Top: \begin{align} \frac{\partial \mu}{\partial x}&=\frac{\mu_+ - \mu_-}{x_+ - x_-} \approx\frac{5 - 7}{0.25 + 0.2}= -4.4 kg/m\\ \frac{\partial \mu}{\partial y}&=\frac{\mu_+ - \mu_-}{y_+ - y_-} \approx\frac{7 - 5}{1.4 - 0.2}= 0.8 kg/m \end{align}
Left: \begin{align} \frac{\partial \mu}{\partial x}&=\frac{\mu_+ - \mu_-}{x_+ - x_-} \approx\frac{8 - 10}{-0.8 + 1.2}= -5 kg/m \\ \frac{\partial \mu}{\partial y}&=\frac{\mu_+ - \mu_-}{y_+ - y_-} \approx\frac{10 - 8}{0.4 + 1.1}= 1.3 kg/m \end{align}
Bottom: \begin{align} \frac{\partial \mu}{\partial x}&=\frac{\mu_+ - \mu_-}{x_+ - x_-}=\frac{6 - 7}{0 + 0.6}= -1.7 kg/m \\ \frac{\partial \mu}{\partial y}&=\frac{\mu_+ - \mu_-}{y_+ - y_-}=\frac{5 - 7}{0 + 1.4}= -1.4 kg/m \end{align}
Right: \begin{align} \frac{\partial \mu}{\partial x}&=\frac{\mu_+ - \mu_-}{x_+ - x_-} \approx\frac{3 - 4}{1 - 0.4}= -1.7 kg/m \\ \frac{\partial \mu}{\partial y}&=\frac{\mu_+ - \mu_-}{y_+ - y_-} \approx\frac{3 -4}{0 + 0.4}= -2.5 kg/m \end{align}
-
On a printout of the figure, draw a qualitatively accurate vector at each point corresponding to the
gradient of \(\mu(x,y)\) using your answers to part a above. How did you choose
a scale for your vectors? Describe how the direction of the gradient vector is
related to the contours on the plot and what property of the contour map is
related to the magnitude of the gradient vector.
Here is an example of what your graph could look like, pay particular attention to the fact that the gradient points uphill and is perpindicular to the contour lines (lines of contant mu). Also gradient vectors near larger densities of contour lines should be larger in magnitude since the contour lines being close correspond to steeper increases.
-
Evaluate the gradient of
\(h(x,y)=(x+1)^2\left(\frac{x}{2}-\frac{y}{3}\right)^3\)
at the
point \((x,y)=(3,-2)\).
\begin{align} \vec{\nabla}h(x,y)\Bigg\vert_{(3,-2)} &= 2(x+1)\left(\frac{x}{2}-\frac{y}{3}\right)^3\, \hat{x} +3(x+1)^2\left(\frac{x}{2}-\frac{y}{3}\right)^2 \left(\frac{\hat{x}}{2}-\frac{\hat{y}}{3}\right)\Bigg\vert_{(3,-2)}\\ &=8\left(\frac{13}{6}\right)^3\, \hat{x} +48\left(\frac{13}{6}\right)^2 \left(\frac{\hat{x}}{2}-\frac{\hat{y}}{3}\right)\\ &=56 \left(\frac{13}{6}\right)^2\hat{x}-\frac{48}{3}\left(\frac{13}{6}\right)^2\hat{y}\approx 194 \hat{x}-75\hat{y} \end{align}
-
Determine \(\frac{\partial\mu}{\partial x}\) and \(\frac{\partial\mu}{\partial
y}\) at each of the four points.